Wednesday 7 June 2017

Linear Regression Implementation in Python

In this post we take the example of previous post to implement simple linear regression. In previous post I explained simple linear regression in detail. You can see the example of simple linear regression by clicking this link http://yasirchoudhary.blogspot.in/2017/06/linear-regression.html

Now I am going to take same example to implement simple linear regression, example is given below in the table.
Investment(X) Revenue(Y)
10 20
15 22
20 35
25 40

Above table shows example of Investment and Revenue in Lacs, Suppose if we Invest 10Lac our Revenue will be 20Lac.

Coding Part:
I assume that you have installed all the required packages which i specified in my previous post. If not installed please install all the packages from this link http://yasirchoudhary.blogspot.in/2017/03/introduction-to-python-libraries.html.  
Now I am going to implement a program in python through which we will know if we invest 30Lac than what will be our revenue.

Steps to follow:
Step 1:
  • First open any text editor which you like and name it as Predict_Revenue.py 
  • Copy the line 1 to 4 in Predict_Revenue.py
  • Run the 4 line code. If your program is error free than you can move further, If not than you missed some packages you can download by reading my previous post 
  • If you install all the packages than run 4 line code again. This time probably you will not face the problem.
  • Now we move to step 2.


Input:
import matplotlib.pyplot as plt
import numpy as np
import pandas as pd
from sklearn import datasets,linear_model

def get_data(file_name):
    data = pd.read_csv(file_name)
    x_parameter = []
    y_parameter = []
    for single_Investment ,single_Revenue_value in zip(data['Investment'],data['Revenue']):
        x_parameter.append([float(single_Investment)])
        y_parameter.append(float(single_Revenue_value))
    return x_parameter,y_parameter

x,y = get_data('inputData.csv')
print (x)
print (y)

# Function for Fitting data to Linear model
def linear_model_main(X_parameters,Y_parameters,predict_value):

    # Create linear regression object
    regr = linear_model.LinearRegression()
    regr.fit(X_parameters, Y_parameters)
    predict_outcome = regr.predict(predict_value)
    predictions = {}
    predictions['intercept'] = regr.intercept_
    predictions['coefficient'] = regr.coef_
    predictions['predicted_value'] = predict_outcome
   #print ('Intercept (β0) = ',regr.intercept_)
   #print ('coefficient (β1) = ',regr.coef_)
   #print ('predict',predict_outcome)
    return predictions

  
x,y = get_data('inputData.csv')
predict_value = int(input('Enter x value for prediction: '))
result = linear_model_main(x,y,predict_value)
print ("Intercept value(β0) " , result['intercept'])
print ("coefficient(β1)" , result['coefficient'])
print ("Predicted value: ",result['predicted_value'])

# Function to show the resutls of linear fit model
def show_linear_line(X_parameters,Y_parameters):
    # Create linear regression object
    regr = linear_model.LinearRegression()
    regr.fit(X_parameters, Y_parameters)
    plt.scatter(X_parameters,Y_parameters,color='red')
    plt.plot(X_parameters,regr.predict(X_parameters),color='green',linewidth=5)
    #plt.xticks(())
    #plt.yticks(())
    plt.show()

show_linear_line(x,y)

Output:
[[10.0], [15.0], [20.0], [25.0]]
[20.0, 22.0, 35.0, 40.0]
Enter x value for prediction: 30
Intercept value(β0)  3.7
coefficient(β1) [ 1.46]
Predicted value:  [ 47.5]
Step 2:
  • I stored data set into csv file with inputData.csv which is shown in the above table.
  • If you want to know how to create csv file than comment below in the post than I will share one post on creating csv file.
  • From line 6, I write a function to get our data into X values (Investment) and Y values (Revenue)
  • In line 7, we read a data into pandas data frame.
  • In line 10 to 13, we convert the pandas dataframe data into X parameter and Y parameter and returning them.
  • In line 16 and 17 we print the X parameter and Y parameter which is shown in output. 
Step 3:
  •  We converted data into X parameter and Y parameter, Now we are going to fit our X & Y parameters into linear regression model.
  • From line 20 to 33, We are going to write a function which will take X & Y parameters and the value which we are going to predict as input and return the  β0, β1 and predicted value.
  •  From line 23 to 24, we created a linear model and trained it with X & Y parameters.
  • From line 26 to 33, we created a dictionary with name predictions and stored  β0,  β1 and predicted values, and returned prediction dictionary as an output.
  • In line 37 I put the value 30 as an input, and we get the predicted value as 47.5 as shown output box.
  • In step 3 our major part of predicting revenue is completed.
Step 4: 
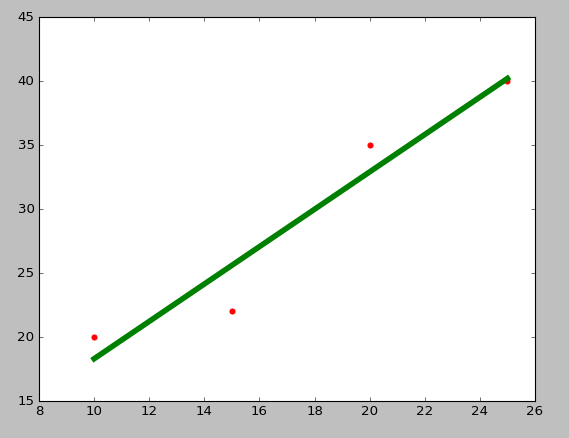
  •   From line 44 to 52, for checking purpose, we write a function which takes X_parameters and Y_parameters as input and show the linear line fitting for our data.
  • Now in line 54 we call a show_linear_line() function, which shows the below graph.

Thursday 1 June 2017

Regression in machine learning

In this post first i am going to explain Regression and next post i will give you code of Simple Linear Regression.

Regression: Regression is a statistical process for estimating the relationship among variables.

Regression is divided into two categories as shown in below figure.


Linear Regression: In Statistics , Linear regression is an approach for modelling the relationships between a scalar dependent variable (say Y) and one or more explanatory variables.
             Linear regression is further divided into two categories Simple Linear Regression and Multiple Linear Regression.

Simple Linear Regression: In Simple Linear Regression there is one dependent variable and one independent variable.
The formula for simple linear regression is given below:
                                             
                   Y = β0+β1.X

Where Y is dependent variable
            β0 is bias or Y-intercept
            β1 is slope
            X is independent variable

To find β1:      β1 = ∑(Xi-X̄)(Yi-Ȳ)/∑(Xi-X̄)2

To find β0:      β0 = Ȳ-β1.X̄

Example: Lets take example as shown in below table;

Investment(X) Revenue(Y)
10 20
15 22
20 35
25 40

Above table shows example of Investment and Revenue suppose if we Invest 10Lac our Revenue will be 20Lac.
Now by above given formula we want to find if we Invest 30Lac what will be our Revenue?

First we will find mean(x) and mean(y):

mean(X) = X̄ = 17.5                    There is Xbar but bar is not shown properly in the screen

mean(Y) = Ȳ = 29.25                    There is Ybar but bar is not shown properly in the screen

X Y (Xi-X̄) (Yi-Ȳ) (Xi-X̄)(Yi-Ȳ) (Xi-X̄)2
10 20 -7.5 -9.25 69.375 56.25
15 22 -2.5 -7.25 18.125 6.25
20 35 2.5 5.75 14.375 6.25
25 40 7.5 10.75 80.625 56.25

 ∑(Xi-X̄)(Yi-Ȳ) = 182.5

 ∑(Xi-X̄)2 = 125

β1 = ∑(Xi-X̄)(Yi-Ȳ)/∑(Xi-X̄)2
β1 = 182.5/125
β1 = 1.46

β0 = Ȳ-β1.X̄
β0 = 29.25 - [(1.46)*(17.5)]
β0 = 3.7

Y = (3.7) + (1.46)(X)
Y = 47.5
                For investment of 30Lac the revenue will be 47.5Lac
I will give you a code of simple linear regression and its explanation in next post.

 Multiple Linear Regression: In Multiple Linear Regression there is one dependent variable and more than one independent variable.
The formula for multiple linear regression is given below:

    Y = β0+β1.X2+β2.X2+β3.X3+...........+βn.Xn

Where Y is dependent variable
              β0 is bias or Y-intercept
              β1,β2,β3,.....,βn is slope
              X1,X2,X3,.....,Xn is independent variables

Logistic Regression: Logistic Regression is a regression model where the dependent variable is categorical. This covers the case of binary two value 0 and 1 , which represents outcome such as pass/fail , loss/win, healthy/sick etc.

The formula for logistic regression for single independent variable is given below:
          P = e(β0+β1.X)  / [1+e(β0+β1.X)]        

The formula for logistic regression for multiple independent variable is given below:
          P = e(β0+β1.X2+β2.X2+.........+βn.Xn)  / [1+e(β0+β1.X2+β2.X2+.........+βn.Xn)]         


Thursday 30 March 2017

Introduction of python libraries for machine learning algorithm implementation

We will use Python programming language for implementation of machine learning algorithms. First of all i want to give you introduction of python programming language.

Introduction to Python programming language:
          Python is a simple, dynamic, general purpose high-level programming language intended to be quick (to learn, use and understand) and has very straight froward syntax.
          Python does not need compilation to binary. You just run the program directly from the source code. Internally, python converts the source code into an intermediate form called bytecodes and then translate this into the native language of your computer and then runs it. All this, makes using python much easier.
          Python supports procedure-oriented programming as well as object-oriented programming. In procedure oriented languages, the program is built around procedures or functions which are nothing but reusable peaces of programs. In object-oriented languages, the program is built around objects which combine data and functionality.

Introduction to python libraries: 
          Python is a great general-purpose programming language on its own, but with the help of a few popular libraries (numpy, pandas, matplotlib, etc) it becomes a powerful environment for scientific computing.

Here i am going to give you list of  python libraries which we will be using in implementation of machine learning algorithm.

1) NumPy: NumPy is the fundamental package for scientific computing with Python. NumPy adds support for large, multi-dimensional arrays and matrices, along with a large library of high-level mathematical functions to operate on these arrays.

2)SciPy: SciPy is an open source Python library used for scientific computing and technical computing. SciPy contains modules for optimization, linear algebra, integration, interpolation, special functions, FFT, signal and image processing, ODE solvers and other tasks common in science and engineering.

3)Scikit-image: scikit-image is an open source image processing library for the Python programming language. It includes algorithms for segmentation, geometric transformations, color space manipulation, analysis, filtering, morphology, feature detection, and  more. It is designed to interoperate with the Python numerical and scientific libraries NumPy and SciPy.

4)Scikit-learn: scikit-learn is a free machine learning library for the Python programming language. It features various classification, regression and clustering algorithms including support vector machines, random forests, gradient boosting, k-means and DBSCAN, and is designed to interoperate with the Python numerical and scientific libraries NumPy and SciPy. 

5)Pandas: pandas is an open source library providing high-performance, easy-to-use data structures and data analysis tools for the Python programming language.
        
6)Matplotlib: Matplotlib is a Python 2D plotting library which produces publication quality figures in a variety of hardcopy formats and interactive environments across platforms. You can generate plots, histograms, power spectra, bar charts, errorcharts, scatterplots, etc., with just a few lines of code.

How to install above libraries?

I am using python 3. version. You can download latest version of python from python official site from here  https://www.python.org/  

For Windows Users:
In command prompt type the below commands for installation of libraries.

1)NumPy: pip install numpy
2)SciPy: pip install scipy
3)Scikit-image: pip install scikit-image
4)Scikit-learn: pip install scikit-learn
5)Pandas: pip install pandas
6)Matplotlib: pip install matplotlib

Windows user can also go to http://www.lfd.uci.edu/~gohlke/pythonlibs/ this site to download the above packages.

For Ubuntu and other open source users:
 In command prompt type the below commands for installation of libraries.

1)NumPy: sudo pip install numpy
2)SciPy: sudo pip install scipy
3)Scikit-image: sudo pip install scikit-image
4)Scikit-learn: sudo pip install scikit-learn
5)Pandas: sudo pip install pandas
6)Matplotlib: sudo pip install matplotlib

In next post we will implement Linear regression algorithm. For implementing machine learning algorithm you need to download above libraries.

Friday 17 March 2017

Steps in developing a machine learning application

1) Collect data: You could collect the samples by scraping a website and extracting data, or you could get information from an RSS feed or an API. To save some time and effort, you could use publicly available data.

2) Prepare the input data: Once you have this data, you need to make sure it’s in a use-able format. You  may  need  to  do  some  algorithm-specific  formatting  here.

3) Analyze  the  input  data: This  is  looking  at  the  data  from  the  previous  task.  This could be as simple as looking at the data you’ve parsed in a text editor to make sure steps 1 and 2 are actually working and you don’t have a bunch of empty values.

4) Train  the  algorithm: This  is  where  the  machine  learning  takes  place.  This  step and the next step are where the “core” algorithms lie, depending on the algorithm.  You  feed  the algorithm  good  clean  data  from  the  first  two  steps  and extract knowledge or information. This knowledge you often store in a format that’s readily use-able by a machine for the next two steps.

5) Test the algorithm: This is where the information learned in the previous step is put to use. When you’re evaluating an algorithm, you’ll test it to see how well it does. In the case of supervised learning, you have some known values you can use  to  evaluate  the  algorithm.
 
6) Use it: Here you make a real program to do some task, and once again you see if all the previous steps worked as you expected. You might encounter some new data and have to revisit steps 1–5.

Steps required for selecting the right machine learning algorithm.

How to choose the right algorithm

1) First you need to consider your goal. What are you trying to get out of this? What data you have or can you collect.

2) If  you’re  trying  to  predict  or  forecast  a  target  value,  then  you  need  to  look  into supervised learning.

3) If not, then unsupervised learning is the place you want to be.

4) If you’ve chosen supervised learning, what’s your target value? Is it a discrete value like Yes/No, 1/2/3, A/B/C, or Red/Yellow/Black?  If so, then you want to look into classification. If the target value can take on a number of values, say any value from 0.00 to 100.00, or -999 to 999, or +infinty to -infinty, then you need to look into regression.

5) If you’re not trying to predict a target value, then you need to look into unsupervised  learning.  Are  you  trying  to  fit  your  data  into  some  discrete  groups?  If  so  and that’s all you need, you should look into clustering.

6) Do you need to have some numerical estimate of how strong the fit is into each group? If you answer yes, then you probably should look into a density estimation algorithm.

  The  rules  I’ve  given  here  should  point  you  in  the  right  direction  but  are  not unbreakable laws. You should spend some time getting to know your data, and the more you know about  it,  the  better  you’ll  be  able  to  build  a  successful  application. 

Friday 3 March 2017

Applications of Machine learning

1) Adaptive website
2) Affective computing
3) Bioinformatics
4) Brain machine interface
5) Classifying DNA sequence
6) Computational anatomy
7) Detecting credit card fraud
8) Economics
9) Game Playing
10) Information retrival
11) Internet fraud detection
12) Marketing
13) Medical diagnosis
14) Natural language processing (NLP)
15) Online Advertising
16) Robot locomotion
17) Search engine
18) Sentiment Analysis
19) Sequence mining
20) Stock market analysis
21) Speech and handwriting recognition
22) Software engineering
23) User behavior analytics

Thursday 2 March 2017

Introduction to Machine learning

In machine learning, computers apply statistical learning techniques to automatically identify patterns in data. These techniques can be used to make highly accurate predictions. 

Definition: A computer program is said to learn from experience E with respect to some class of tasks T and performance measure P, if its performance at tasks in T, as measured by P improves with experience E
Example:  Learning to play checker
Task T: design a program to learn to play checker
Performance measure P: The percentage of the games won
Experience E: Playing against itself

Types of Machine learning algorithm:
1) Supervised learning: This algorithm consist of a target variable or dependent variable which is to be predicted from a given set of predictors (independent variables). Using these set of variables, we generate a function that map inputs to desired outputs. The training process continues until the model achieves a desired level of accuracy on the training data. Examples of Supervised Learning: Regression, Decision Tree, Random Forest, KNN, Logistic Regression etc. 

2) Unsupervised learning:  In this algorithm, we do not have any target or outcome variable to predict / estimate.  It is used for clustering population in different groups, which is widely used for segmenting customers in different groups for specific intervention. Examples of Unsupervised Learning: K-means.

3) Reinforcement learning: Using this algorithm, the machine is trained to make specific decisions. It works this way: the machine is exposed to an environment where it trains itself continually using trial and error. This machine learns from past experience and tries to capture the best possible knowledge to make accurate business decisions. Example of Reinforcement Learning: Markov Decision Process

Monday 2 January 2017

C Program to Swap Two Numbers

Program:
This program is saved as Swap.c

Output:

Sunday 1 January 2017

C Program to find greatest of three numbers

Program:
This program is saved as GreatestOfThree.c

Output:

C Program to Add n numbers

Program:
This program is saved as Add.c

Output:

C Program to Add Subtract Multiply and Divide the numbers

Program:
This program is saved as AddSubMulDiv.c 
Type casting is a way to convert a variable from one data type to another data type. For example, if you want to store a long value into a simple integer then you can type cast long to int. You can convert values from one type to another explicitly using the cast operator.

New data type should be mentioned before the variable name or value in brackets which to be typecast.

Converting an expression of a given type into another type is known as type-casting . typecasting is more use in c programming language.

It is best practice to convert lower data type to higher data type to avoid data loss.

Data will be truncated when higher data type is converted to lower. For example, if float is converted to int, data which is present after decimal point will be lost.

Output: