In this post we take the example of previous post to implement simple linear regression. In previous post I explained simple linear regression in detail. You can see the example of simple linear regression by clicking this link http://yasirchoudhary.blogspot.in/2017/06/linear-regression.html
Now I am going to take same example to implement simple linear regression, example is given below in the table.
Above table shows example of Investment and Revenue in Lacs, Suppose if we Invest 10Lac our Revenue will be 20Lac.
Now I am going to implement a program in python through which we will know if we invest 30Lac than what will be our revenue.
Steps to follow:
Step 1:
Input:
Output:
Step 3:Now I am going to take same example to implement simple linear regression, example is given below in the table.
| Investment(X) | Revenue(Y) |
|---|---|
| 10 | 20 |
| 15 | 22 |
| 20 | 35 |
| 25 | 40 |
Above table shows example of Investment and Revenue in Lacs, Suppose if we Invest 10Lac our Revenue will be 20Lac.
Coding Part:
I assume that you have installed all the required packages which i specified in my previous post. If not installed please install all the packages from this link http://yasirchoudhary.blogspot.in/2017/03/introduction-to-python-libraries.html. Now I am going to implement a program in python through which we will know if we invest 30Lac than what will be our revenue.
Steps to follow:
Step 1:
- First open any text editor which you like and name it as Predict_Revenue.py
- Copy the line 1 to 4 in Predict_Revenue.py
- Run the 4 line code. If your program is error free than you can move further, If not than you missed some packages you can download by reading my previous post
- If you install all the packages than run 4 line code again. This time probably you will not face the problem.
- Now we move to step 2.
import matplotlib.pyplot as plt
import numpy as np
import pandas as pd
from sklearn import datasets,linear_model

def get_data(file_name):
    data = pd.read_csv(file_name)
    x_parameter = []
    y_parameter = []
    for single_Investment ,single_Revenue_value in zip(data['Investment'],data['Revenue']):
        x_parameter.append([float(single_Investment)])
        y_parameter.append(float(single_Revenue_value))
    return x_parameter,y_parameter

x,y = get_data('inputData.csv')
print (x)
print (y)

# Function for Fitting data to Linear model
def linear_model_main(X_parameters,Y_parameters,predict_value):

    # Create linear regression object
    regr = linear_model.LinearRegression()
    regr.fit(X_parameters, Y_parameters)
    predict_outcome = regr.predict(predict_value)
    predictions = {}
    predictions['intercept'] = regr.intercept_
    predictions['coefficient'] = regr.coef_
    predictions['predicted_value'] = predict_outcome
   #print ('Intercept (β0) = ',regr.intercept_)
   #print ('coefficient (β1) = ',regr.coef_)
   #print ('predict',predict_outcome)
    return predictions


x,y = get_data('inputData.csv')
predict_value = int(input('Enter x value for prediction: '))
result = linear_model_main(x,y,predict_value)
print ("Intercept value(β0) " , result['intercept'])
print ("coefficient(β1)" , result['coefficient'])
print ("Predicted value: ",result['predicted_value'])

# Function to show the resutls of linear fit model
def show_linear_line(X_parameters,Y_parameters):
    # Create linear regression object
    regr = linear_model.LinearRegression()
    regr.fit(X_parameters, Y_parameters)
    plt.scatter(X_parameters,Y_parameters,color='red')
    plt.plot(X_parameters,regr.predict(X_parameters),color='green',linewidth=5)
    #plt.xticks(())
    #plt.yticks(())
    plt.show()

show_linear_line(x,y)
Output:
[[10.0], [15.0], [20.0], [25.0]]
[20.0, 22.0, 35.0, 40.0]
Enter x value for prediction: 30
Intercept value(β0)  3.7
coefficient(β1) [ 1.46]
Predicted value:  [ 47.5]
Step 2:
- I stored data set into csv file with inputData.csv which is shown in the above table.
- If you want to know how to create csv file than comment below in the post than I will share one post on creating csv file.
- From line 6, I write a function to get our data into X values (Investment) and Y values (Revenue)
- In line 7, we read a data into pandas data frame.
- In line 10 to 13, we convert the pandas dataframe data into X parameter and Y parameter and returning them.
- In line 16 and 17 we print the X parameter and Y parameter which is shown in output.
- We converted data into X parameter and Y parameter, Now we are going to fit our X & Y parameters into linear regression model.
- From line 20 to 33, We are going to write a function which will take X & Y parameters and the value which we are going to predict as input and return the β0, β1 and predicted value.
- From line 23 to 24, we created a linear model and trained it with X & Y parameters.
- From line 26 to 33, we created a dictionary with name predictions and stored β0, β1 and predicted values, and returned prediction dictionary as an output.
- In line 37 I put the value 30 as an input, and we get the predicted value as 47.5 as shown output box.
- In step 3 our major part of predicting revenue is completed.
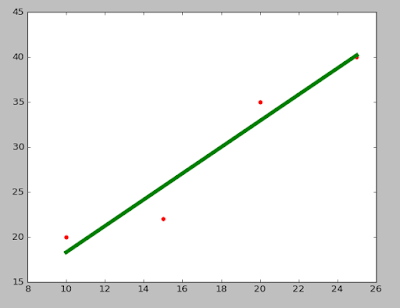
- From line 44 to 52, for checking purpose, we write a function which takes X_parameters and Y_parameters as input and show the linear line fitting for our data.
- Now in line 54 we call a show_linear_line() function, which shows the below graph.

No comments:
Post a Comment